Shorehill Golf
Helping golf facilities become more enjoyable, sustainable and profitable using golfer GPS data
What We Do
We track and analyse how golfers of different ages, genders and handicaps engage with golf courses to provide precise and actionable data to inform on-course projects of any size.
Why Data
Why golfer GPS data can help facilities of all kinds improve, regardless of budget, business model or climate.

-
Golfer GPS data provides unbiased, reliable and highly precise data on which to make decisions in the design, management and maintenance of any golf course.
-
The process of data collection allows all golfers to engage with the decision-making process, improving buy-in from an early stage.
-
Getting plans approved is a notoriously tricky business; data provides statistical evidence to support your proposals and cut through opinion-based objections.
-
The impact of any change to the golf course, large or small, can be measured by comparing pre and post-project data. This enables both compound improvements to the course and a means to showcase how your work has measurably improved the facility.
-
Ultimately, we founded Shorehill to leverage data to ensure facilities most efficiently achieve their desired outcomes. This data ensures on course investment is directed where it will have the greatest possible impact.

“It is a capital mistake to theorise before one has data”
Sir Arthur Conan Doyle
What We Report On:
Reducing Maintenance Costs
Identifying areas of high cost with low value to the golfer experience, enabling precision maintenance and ensuring on-course investment is spent where it matters most.
Analysing Hole Strategy
Analysing how golfers of different ages, genders and handicaps play each hole in relation to tees used, pin positions, weather conditions and more. We can isolate bunkers and other features to see exactly which golfers are visiting them.
Reducing Pace of Play
Review pace of play across the golf course, including how specific features or areas contribute to slow play. Monitor how changes to the design or set-up of the course impact playing time.
Enhancing The Golfer Experience
The first step to improve the golfer experience is to understand it; leverage precise and informative data to ensure every decision you make enhances the experience of your golfers.
Informing Renovation Plans
Use real golfer data to inform renovation plans, then test proposals against our findings. Ensure the maximum return on investment, whatever the specific aims of the facility.
Improving Playability
Data of this kind gives us equal visibility of how all golfers play your course. Ensure decisions positively impact every golfer, particularly beginners, women and juniors.
Plus:
Promoting Sustainable Course Management | Analysing Foot & Cart Traffic | Improving Turf Health | Documenting Safety Margin Issues


How we track data
At check in, golfers are asked to download the app - they can scan a QR code or go to the App/Google Play Stores.
In the app, they provide their age, gender, handicap and whether they are using a cart, then press ‘Start Round’ - it takes 1 minute.
They can forget about the app and go about their day as normal- we do the rest!
Packages
We are flexible in our approach depending on the timeframes and requirements of our clients. We have outlined our three primary packages below, but will gladly offered tailored solutions to suit you.
Pace of Play Analysis
-
A one-off report focusing on current pace trends for each hole, bottlenecks, and what can be done to improve.
-
10 days (usually).
-
£1,000 / $1,250 + expenses.
Full Course Consulting
-
Ongoing analysis and refinement using data to inform decisions in the short, medium and long term. Used to ensure continuous improvement over time.
We collaborate with the club and stakeholders, collecting & presenting all data in relation to their specific aims.
-
Flexible depending on the needs of the club. We normally recommend 3 weeks per year.
-
£4,000 / $5,000pa + expenses.
Full Course Report
-
A thorough, one-off analysis of the golf course designed for large scale renovation or redesign projects with short timeframes. We work alongside all parties to inform and test project proposals.
-
Flexible depending on project deadlines. Usually 3-5 weeks.
-
£8,000 / $10,000 + expenses.

“No game depends so much as golf on its arena for success; on an interesting course an interesting game will be played; on a badly planned green the same will be dull.”
John Low
Case Study
Across 9 holes at a mid-range facility in the UK we found:
Up To £7,000 Annual Maintenance Savings | 2-4% Reduction In Water Usage | 7-11 Minutes Pace Of Play Improvements
Plus:
-Strategies to improve turf health
-Foot traffic issues & solutions
-Improvements to course renovation plans
-Opportunities for improved playability
-Changes to cart path placement
-Enhancements to the golfer experience


-The trio of images show the raw heatmap data by handicap (>4, 5-15, 15+) for a mid-length par 4 hole.
-See how 87% of golfers walk off the intended path to the green (to the left), instead cutting in front of the left greenside bunker.
-The placement of the greenside bunker funnels golfers into a small area in front of the green where they leave their bag, then putt, collect their bag then continue over the green to the next tee.
-This flow causes significant maintenance issues in the area in question and adds up to 30s to average playing times.
-We analysed which golfers (by age, gender and handicap) played from the bunker. We found it plays no strategic role; it caught only 1.5% of golfers.
-The bunker also plays no visual role as it is blind from the fairway.
-Given the annual cost to maintain, and costs associated in its renovation, we discussed removing the bunker entirely.


Our Findings For This Hole Included:
£1,000-£2,000 Annual Maintenance Savings | 30-45s Pace of Play Improvement | Playability Enhancements | Tee Placement Suggestions | Foot Traffic Issues & Solutions | Documented Safety Margin Concerns | Key Shot Location Hot-Spots

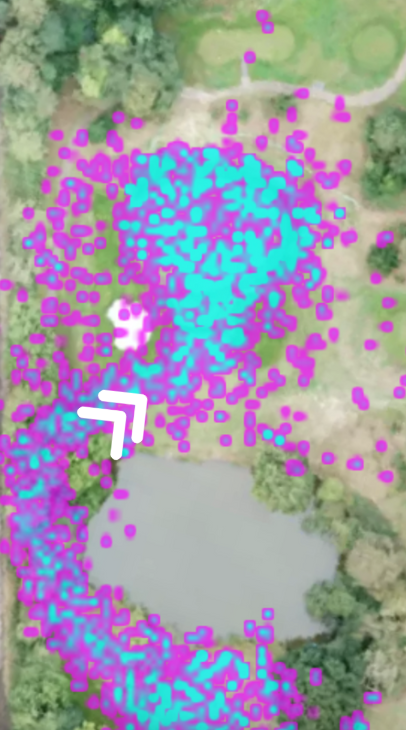
-These images compare raw heatmap and shot location data for golfers over the age of 40 on a 560 yard par 5.
-The hole ranked poorly in golfer satisfaction surveys, and was slowest for pace of play by a wide margin.
-By isolating shots hit in specific bunkers and areas of rough, we saw that the structure of the lay-up area and green was responsible for the slow pace of play and low satisfaction.
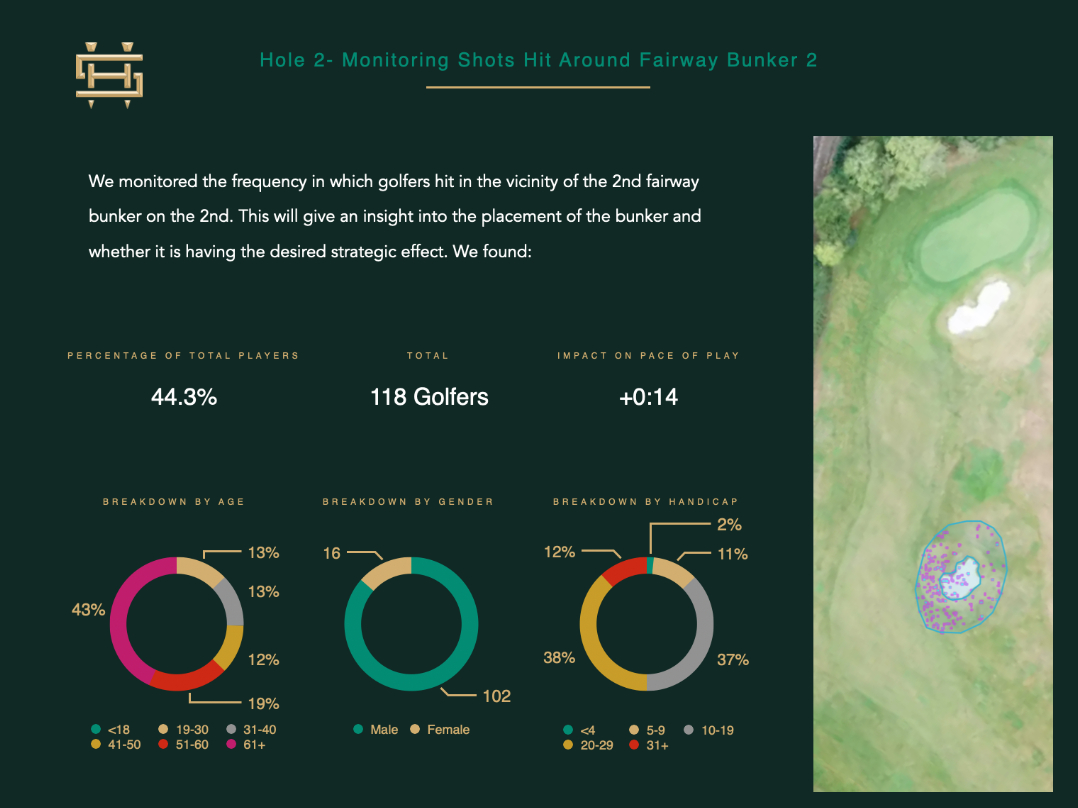
-44.3% of golfers found themselves in or around the lay-up bunker (see below). From here <10% could hit the green (only 60-80yds away).
-This caused backlogs in the driving area and from the tee, compounding pace of play problems.
-Discussed solutions included removal of fairway bunkers, reshaping the green, shrinking the greenside bunker and creating a split fairway to provide interest to the lay-up with reduced punishment for stray shots.

Our Findings For This Hole Included:
£3,000-£4,000 Annual Maintenance Savings | Up to 2 Minutes Pace of Play Improvement | 8% Reduction in Finely Maintained Turf | Improved Strategy | Enhanced Golfer Satisfaction

-We documented the frequency in which golfers hit onto an adjacent hole; 1 in 7 golfers hit onto the wrong fairway.
-To find a solution, we created a profile of the golfers who hit into the area in question by age, gender, handicap and tee used.
-Using this, we examined the playing trends of these golfers to uncover any targeted solutions rather than implementing a ‘one-size fits all’ approach.

Our Findings For This Hole Included:
Measured & Documented The Severity of Safety Margin Issues | Identified The Most Likely Player Types & Conditions For Hitting Astray| Created Specific Solutions Using Data
Contact us to learn more